What are Grafana data sources and how to configure prometheus as datasource in Grafana


Siddharth Sabale

What is a data source in Grafana?
Data sources can be any entity that provides you access to data that you want to visualize in a dashboard. Data sources can be a SQL database, a JSON-api or even a CSV file.
Sometimes it is difficult to understand the different querying techniques for different kinds of data, but with practice, we get used to it.
We can also configure to get data from multiple sources into a single dashboard view.
What are plugins in Grafana?
The plugin is software that adds new functionalities to our grafana. There are various types of plugins but right now we care about data source plugins.
The job of the data source plugin is to take the query we want to be answered, fetch data from the source, and resolve the differences between the data models of data source and Grafana dashboards. This is done using a unified data structure called a data frame.
Currently, Grafana supports a diverse range of 155 data sources, making it a single platform for observability.
Explore all data source plugins here, and you can also create a custom plugin for your data source.
How to configure Prometheus as the data source in Grafana?
By default, Grafana will be listening on http://localhost:3000. The default login is "admin" / "admin".
To create a Prometheus data source in Grafana:
- Click on the "cogwheel" in the sidebar to open the Configuration menu.
- Click on "Data Sources".
- Click on "Add data source".
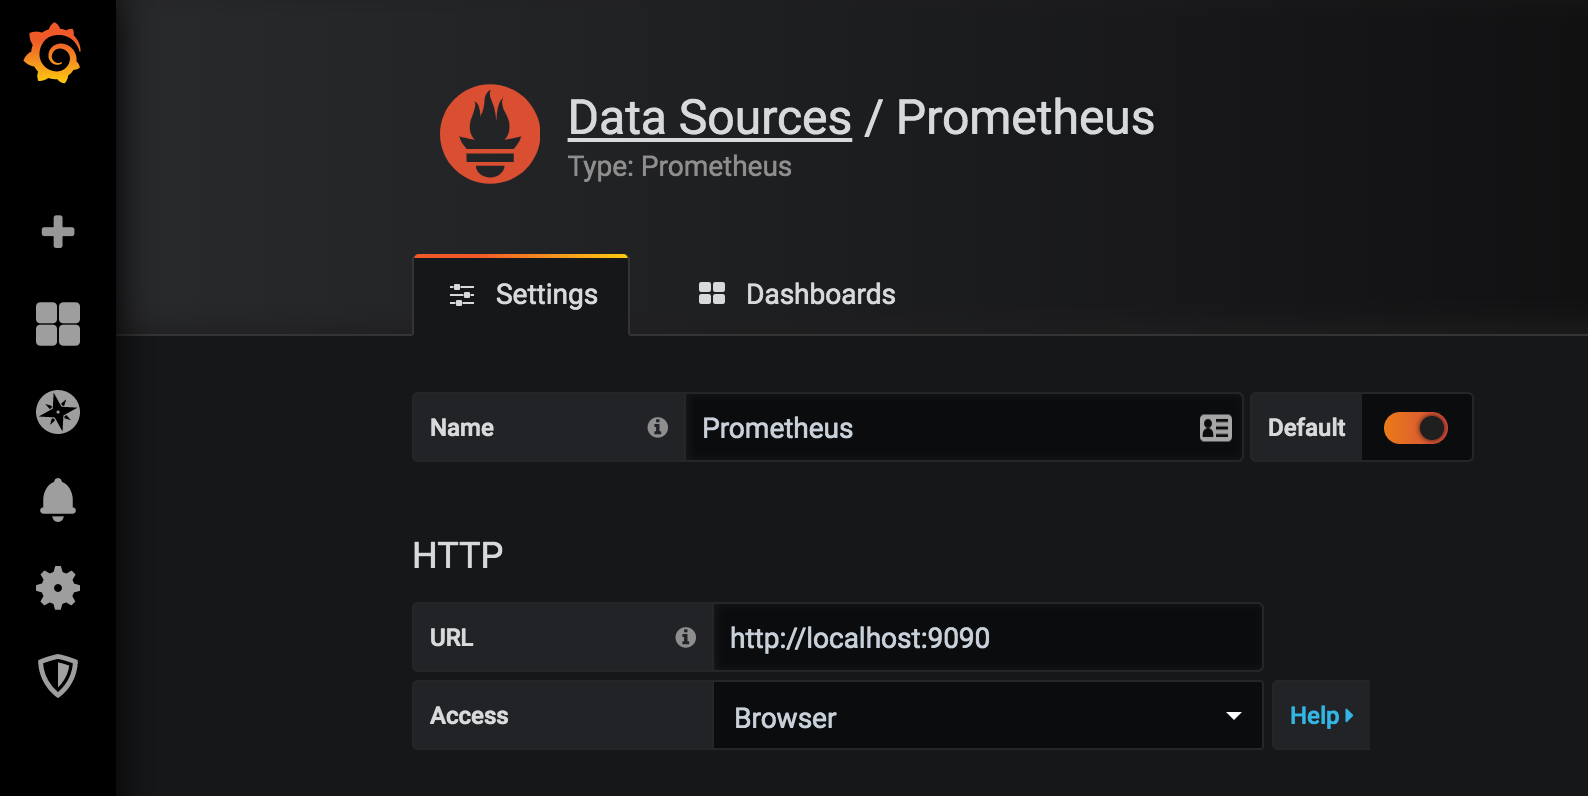
- Select "Prometheus" as the type.
- Set the appropriate Prometheus server URL (for example,
http://localhost:9090/) - Adjust other data source settings as desired (for example, choosing the right Access method).
- Click "Save & Test" to save the new data source.
The following shows an example data source configuration:
That's a wrap! Stayed tuned for more grafana nuggets coming up 💙
Looking for reliable development partners? Check out our curated list of offshore software development companies.